Deep Learning for Exploring Harpy Eagle Habitats
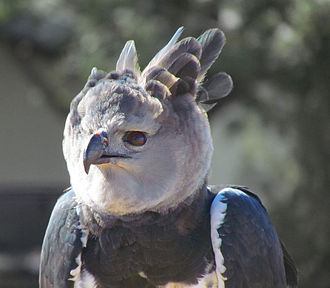
Harpy Eagles are the largest and most powerful raptors in the Americas with ecological importance as an apex predator as well as a cultural icon. Unfortunately their populations have dwindled over the last few decades due to forest fragmentation and hunting. Understanding the conditions favored by Harpy Eagles will help researchers protect current populations and make reintroduction of the species more successful. Therefore we are leveraging the power of deep learning to help ecologists better understand the rain forests that the Harpy Eagle inhabits.
In 2016 we flew several UAV flights over the Bladen National Reserve in Belize taking aerial photographs of the canopy. The resulting orthomosaic, a large image stitched together from hundreds of smaller photographs, encompasses roughly 7 km^2 with a spatial resolution of approximately 10 cm/pixel. This huge amount of data needed to be processed in a way that helped ecologists discover nesting pairs of eagles. Finding nests directly quickly proved to be an impossible task in such a massive amount of data. A method to narrow the search was needed. We do know that Harpy Eagles prefer trees that reach above the canopy. Cohune Palm trees proved to be the ideal target as though they are not particularly tall themselves they are important indicators of soil type which is a strong determinant for tree height.
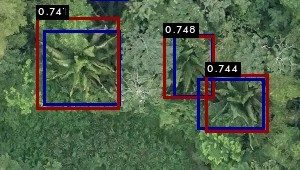
The main obstacle to locating Cohune Palm trees was the time it took to manually count individual trees. Imagine playing ‘Wheres Waldo’ with an area of rain forest the size of 75 football fields containing thousands upon thousands of trees. An automated method for processing this data was needed to make it feasible. Convolutional neural networks are a hot topic in deep learning that attempt to emulate how the human visual cortex work. They work extremely well at recognizing objects in images making them an ideal solution. Like a human the machine must be taught what the object or in our case a palm tree looks like before hand. We therefore had to still had to find some palm trees ourselves in order to teach the algorithm. The image below shows the comparison between what the program decided was a palm tree (red) compared to a training sample provided by a human (blue).

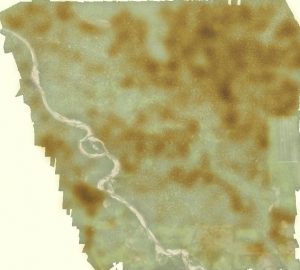
We can apply this same technique of detecting palm trees to the entire aerial data set to create the heat map map below. Any place with a darker orange color has a higher density of palm trees allowing researchers to easily pick out trends in the population distribution. Comparing the machine results to the human baseline we found that the machine was able to find 97% of all palm trees with very few false detections. This is a first step in analyzing the aerial data with many more aspects to explore.