Measuring Bird Presence in the Peruvian Amazon Using Neural Network Predictions
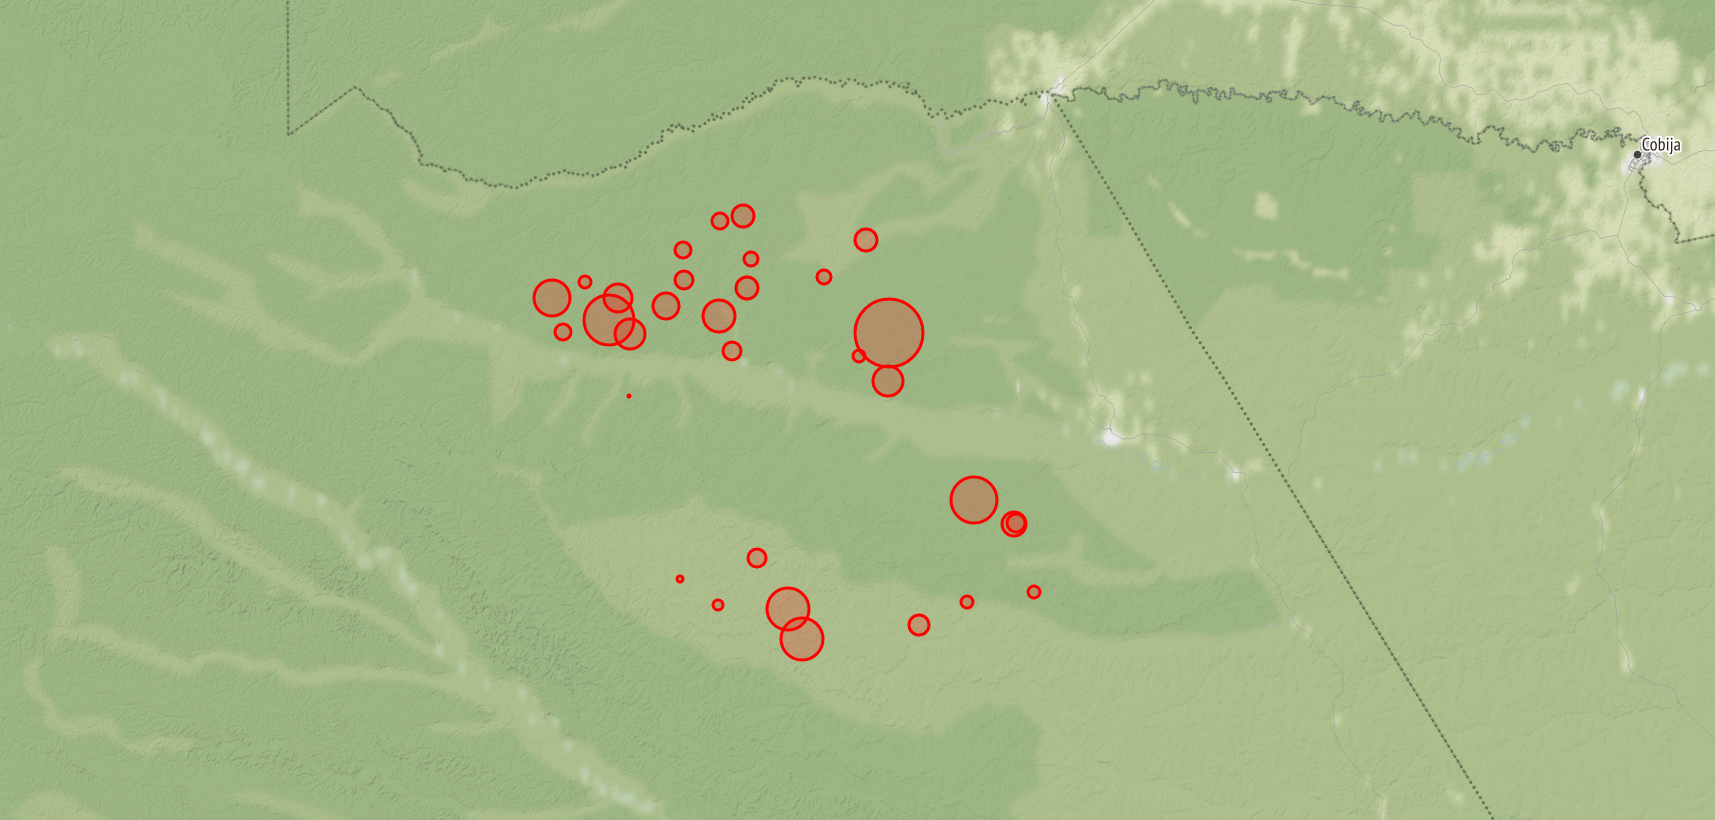
On April 13th, 2021, the Acoustic Species Identification project lead Jacob Ayers posted a dataset containing the predictions from a Recurrent Neural Network (RNN) trained to estimate the probability of bird presence (global scores) across close to 100,000 audio clips from the Peruvian Amazon. The dataset also contained information about the Audiomoth audio recording devices such as latitudinal and longitudinal coordinates and when each audio clip was created. The Acoustic Species Identification team and its collaborators took on the task of interpreting the dataset and producing different visualizations of their findings.
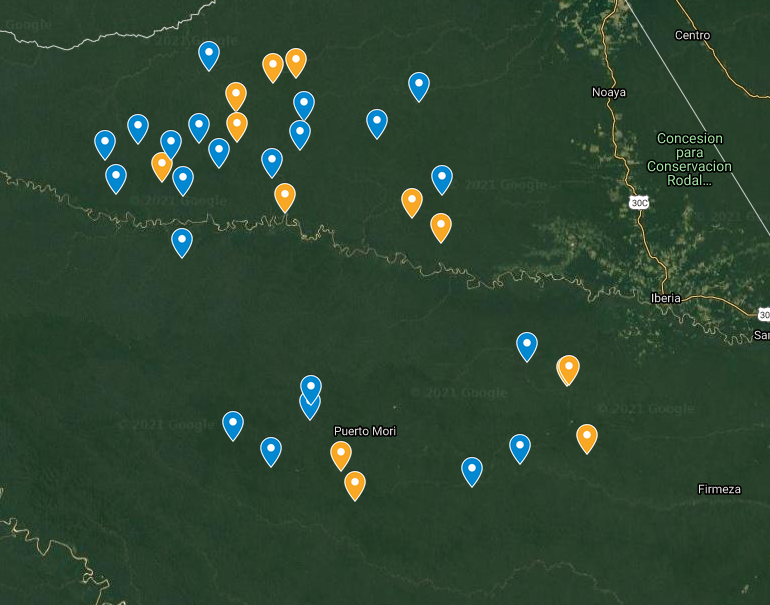
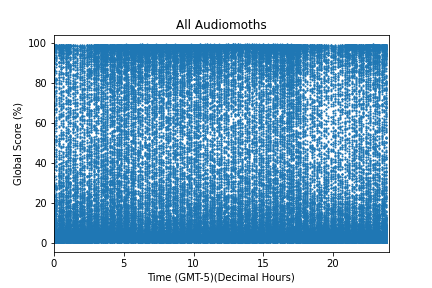
The map on the left (produced by Matthew Mercurio) shows where in the Peruvian Amazon the Audiomoths were placed as well as having the yellow pins represent whether or not the audio recorded fits an expected trend (more discussion on this coming). The graph on the right demonstrates the challenge of trying to derive meaning from a dataset with so many data points.
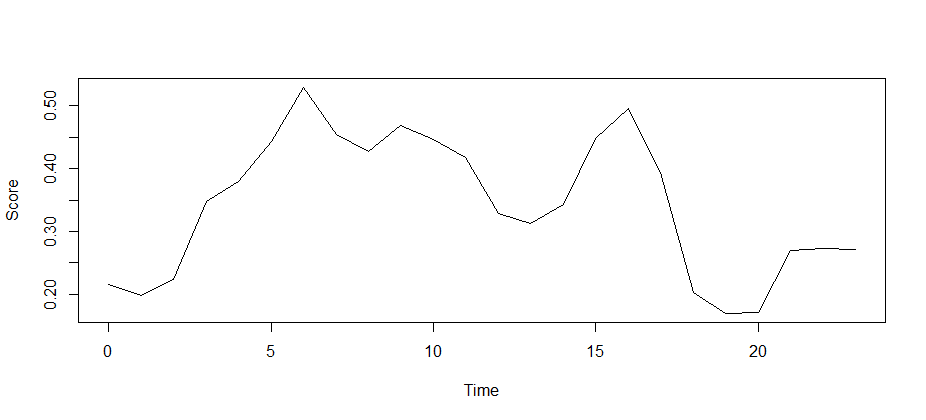
One of the main San Diego Zoo Wildlife Alliance collaborators, Mathias Tobler, averaged all of the clip global score predictions with respect to time and was able to demonstrate the capability of the Microfaune RNN to pick up on the expected trend of bird vocalization activity peaking during dawn and dusk.
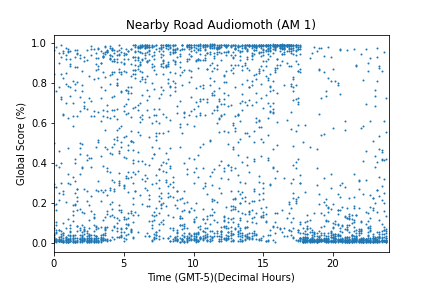
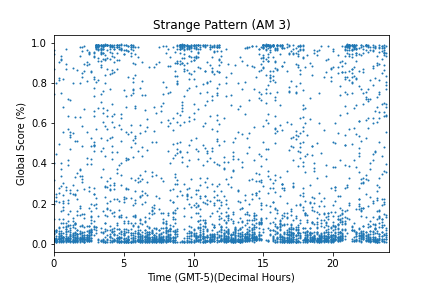
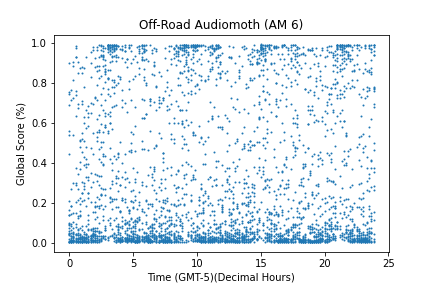
The team did find an unexpected trend of four six hour interval peaks as seen in the “Strange Pattern” figure. Jacob decided to plot the only Audiomoth device that was listed as “Off-Road” and compared its closest neighbor “Nearby Road Audiomoth”. These plots also demonstrated a contrast between the expected Dawn-Dusk Chorus and the unexpected six hour intervals.
In the future, the Acoustic Species Identification team will investigate into what is causing the odd six hour intervals. They also hope to produce more datasets derived from the various audio recordings and tools they work with, which can be used for future team data science challenges.
